Trading with the trend is one of the best ways to succeed. However, identifying a trend in the markets can be a bit tricky; trends start and stop, continue and reverse. Once a trend starts, it doesn’t go straight up or down, but will have areas of retracement or pull back. The very nature of the market forces of supply and demand makes sure that there are natural levels of profit taking in most market moves. One of the most important elements of successful trading is identifying these pullbacks and to understand if they are just temporary pauses, or if they are actually market reversals. This is where analysis of the price action comes in. We can use certain price patterns based on this price action to help determine if these pull backs are possible setups for an entry.

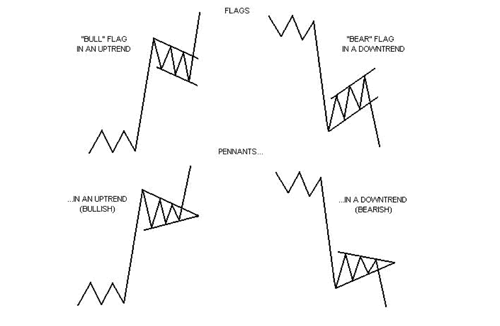
One type of price pattern we can use is a continuation pattern such as a Bull Flag or Bull Pennant for an uptrend market or Bear Flags and Bear Pennant for a downtrend market. These patterns help us to identify areas of continuation, looking at a pull back or a consolidation and resumption of previous trend after the pull back. Here are some examples of what these continuation patterns look like:

Flags and pennants can be generally categorized as continuation patterns. These price patterns usually show brief pauses in a strong trend. They are usually seen right after a larger quick move. The market will often pick up again in the same direction. Over time these continuation price patterns are very good at identifying potential entry points.

Bull flags are characterized by lower tops and lower bottoms, with the pattern slanting against the trend. But unlike wedges of a Bull Pennant, their support and resistance lines run parallel.

Bear flags are comprised of higher tops and higher bottoms. “Bear” flags generally slope against a strong down sloping trend.

Pennants are similar to flags but are not parallel and look very much like symmetrical triangles. Pennants are also generally smaller in size or volatility and duration than Flag patterns.

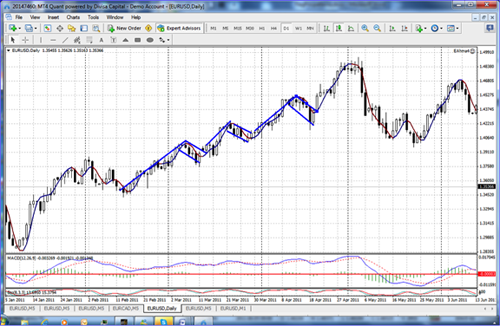
Here is a recent example of several bull flags on the AUDUSD Daily Chart:

Note in the graph above that after a move up, the Bull Flag is formed by the lower highs and lower lows in a pullback and once it broke above the flag it resumed the bullish uptrend and then another Bull Flag formed by more parallel lower highs and lower lows running against the uptrend, and once the pullback is “broken” the price breaks out and continues the previous up trend for a very positive gain. The best way to take advantage of this pattern is to set a “buy stop” entry order close to the top of the pullback so that if the trend resumes to that level you would be triggered into the trade to take advantage of the continuation. The same patterns apply to a bearish downtrend but in the reverse pattern and with a “sell stop” at the bottom for an entry order.

Take some time on the charts to look for these Flags and Pennant patterns to help identify good entry points as the current trend resumes.
Just when we think the gold market is ready to take off, it decides to drop back down again. This just proves that it doesn’t matter what we think; the only thing that matters is what the market is actually doing. Today we are going to look at three charts: the weekly, daily and 4-hour time frames. As we look at these, we will point out the important areas of support and resistance that may be important to know in the near future.

As we begin, we will first look at the weekly chart, which will help us see the “big” picture of how the gold market has been moving over the longer-term. There are two fairly obvious things that we should get from this view. First, the overall trend has been moving down since the high back in 2012. The second is that we have a very well-defined area for both support and resistance. In addition, as you look at these two lines you will notice that they are converging into a point. This consolidation often times leads to some sort of breakout. We will keep this in mind as we look for potential directional changes for the price of gold.

This next chart shows the daily price action of gold.

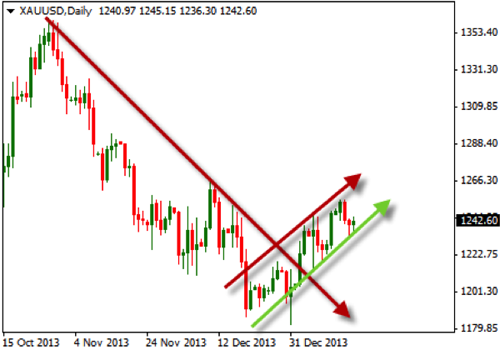
In this chart you will notice that the daily trend has been moving down, but has recently moved back up. These two up arrows indicate the areas of support and resistance on a more intermediate time frame. Because of the downtrend, we would be looking to trade in the direction of the trend on a break down from the green support area; this would be with a trend trade entry. A break above the prior high, around 1266, would give support to the idea that the price wants to move up again. We will keep our eyes on these daily price areas.

The third chart below is of the 4-hour time frame. This will give us the shorter-term outlook of the price action of gold.

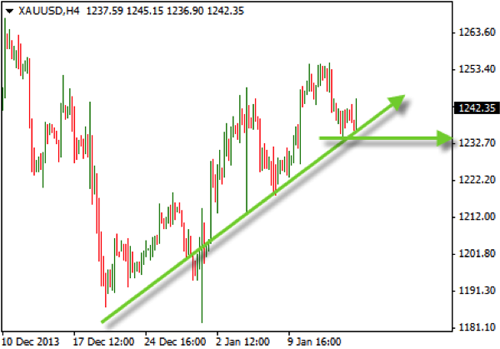
In this 4-hour chart you can see the current uptrend a bit closer. You will notice the pattern the price is making of higher highs and higher lows. You can also see the green arrows, which represent the areas of support. Currently, the price is moving up and off support. This might be an area where we see the price moving higher on. A break of this support could lead to another down move.

With gold trying to decide where it wants to go, it is a good idea to look at multiple time frame charts to get a better overall picture of what might happen. As we look at the longer-term view, we can see things that we might be missing when looking at shorter-term charts. This is important even if we are trading a 5 min. chart, as we will have better insight into the short-term moves. Take some time to review this to see how it might help with your trading.

The key to any good trading plan is to have a good, clear set of rules to follow. Many traders get into trouble when they trade on emotions instead of rules. Trading without a specific trading plan and specific rules can create or maintain bad habits. Many traders don’t have a trading plan.

A trading plan should naturally include a trading strategy or method. Included in the strategy should be a set of clear entry and exit rules, depending on the markets traded (stocks, options, Forex, etc.) and the various market conditions. A successful system will also have well-defined setup rules, entry rules, trade management and then clear exit rules. In other words, your system should be clear enough to identify setups and be easy enough to execute. Before you ever place a trade, you should clearly be able to identify, clarify, and justify your trade with clear entry and exit rules. No matter what instruments you trade, be it stocks, options, futures or Forex, or whether you are a longer-term position trader, a swing trader or a short-term scalper, without clear rules to follow, you will find it very difficult to have long-term success.

Your rules should be easy to describe and be repeatable so that you can backtest the results on past data. Now this will not guarantee the same success into the future, but backtesting over a period of time will allow you to become more confident in how the system works in a variety of different market conditions. For example, how does the system work if the market is trending higher, trending lower, or the market is range-bound and moving sideways? The more we can test the system, the more confident we will become and the more we can rely on certain outcomes.

If you have clear rules that you can follow and test, you will be able to be more patient in a trade to give it enough time for it to get to the profit target. It will also be easier to recognize when a trade has failed and, therefore, will be easier to cut your losses and move on to a more profitable trade. In other words, you will become significantly less fearful about your trading in general and, hopefully, you can become much more successful as a trader instead of being more of a “fly-by-the-seat-of-your-pants” type of trader.

In conclusion, having a written trading plan, with a clear set of rules to follow, will lead you to be a more confident trader and allow you to have far more discipline in your trading. It will allow you to control the trading emotions of fear and greed more easily. When traders don’t follow their rules, they can get fearful and often talk themselves out of good trades and into bad ones, which will generally lead to a weaker results, which can lead to more emotions and less discipline and can cycle out of control. So, define your rules, write them down, test them, and then FOLLOW THEM!

Today we are going to discuss a bit about controlling our risk when trading. There are several things we can do that will put us in a position where we won’t have to worry about losing too much. The first way we can control our risk is to not trade at all. This would put us in a situation where we would not be at risk of losing anything. Of course, this would also put us in a situation where we would never make anything either. This is usually not the way most traders would choose to control their risk.

Another way to control our risk is to set a specific amount that we are willing to risk in each trade we take. This is known as our ‘Single Trade Risk’. This means that we decide on an amount that, if we lose, we are still going to feel okay with it. For each trader, this might be a different amount. The amount may also be different depending upon your account size. For example, if I had a $100,000 account, I might be okay with losing $1,000. But, if my account size were $2,000, this would not be a good idea. So we need to determine what that amount is that makes us feel okay with losing, should we get stopped out of our trade. A simple way to approach this would be to set a specific percentage that we are willing to lose on each trade. In the above example, if we set our loss size to 1% of our account, we would be willing to lose $1,000 on our $100,000 account, but only $20 on our $2,000 account. By knowing the percent we are willing to lose, we can easily calculate what our overall risk will be per trade.

Another risk control we may want to consider is our overall portfolio. This is an overall combination of all the single trades we currently are trading. We may decide that our single trade risk is 1%, but our overall portfolio risk can never be more than 10%. This would mean that we would only be able to have 10 trades going at the same time. If our single trade risk were 2%, then the most trades we could have would be 5. Take some time to consider what your overall portfolio risk should be and consider how you would feel if you took losses on all your positions at the same time. Only you can decide your level of comfort with loss.

In addition, you may want to consider a position number limit to help you control the amount of trades you are willing to trade at any one time. This may be different than that of your total trades based off of your portfolio risk. Some traders cannot handle 10 or 20 trades happening at the same time. If you are trading that many and do not feel comfortable doing so, you are putting yourself in a bad situation where you may make poor decisions. Maybe you can only handle 2-3 trades right now. This is okay; the important thing is you know what the appropriate number of trades will be in order for you to trade the best you can.

Regardless of your level of comfort with risk, you need to know how to control it so it does not control you. Take some time to review these things within your own trading so you can become a better trader.

Today I’d like to continue from last week with a second trading resolution for 2014 trading success. The first trading resolution was to get, and stick to, a good trading routine that is both productive, practical, and consistently implemented. This needs to be a routine that you can implement and maintain over time. The second trading resolution is to follow a good set of risk management rules.

The truth is that risk management is the key to any good trading plan. You can have a great trading system, but if you are not using sound risk management, you may be risking too much of your account at any one time and you are putting your trading success in jeopardy.

The first thing to understand about managing risk is that you should not get into a situation where you are risking your account on just a few trades. Instead, you should follow the 1% risk rule – in other words, risk a maximum of 1% of your account on any one specific trade and limit the total number of trades to a maximum of 10, risking 10% total at any one time. To do this, it’s important to use proper stop loss and trailing stop orders when you get into trades. You will be able to sleep at night much better knowing that you will never be in one large, single “bet-the-farm” type of position.

Before ever entering a trade, you should determine what that risk per trade is in dollars. If you have a $10,000 account, you can then risk up to $100 per trade ($10,000 x 1%). This will help you to determine the position size or the total number of shares to trade or the position size based on the $100 maximum risk. The way to calculate the position size is to calculate the risk per share. To determine the risk per share, calculate the difference between the entry price and the initial stop loss level. For example, if the entry price is $25 per share and the initial stop loss is set at $24 (I believe that a stop loss level based on support or resistance is better than a predetermined set stop loss level), then, based on this example, the risk per share would be $1, so you would trade 100 shares and limit your risk to a maximum 1% for this trade. This will help you limit your risk and not accept more risk than is wise per trade.

So to review, the keys to limiting your account risk are to always determine the maximum risk you are willing to take per trade and always use a stop loss to determine proper position size of the trade, and then be sure to limit the number of trades to keep your total account risk under 10%.

Following this 2014 trading resolution will allow you to establish and follow sound risk management rules and give you the best chance to succeed in the markets.

Pretty much everything in the universe seems to be cyclical; for the most part, nothing moves consistently in one direction all of the time. For every action, there is an equal and opposite reaction, there is the whole yin yang concept, and for good to exist evil must exist etc. With that said, the stock market, and investing in general, must be no different. The stock market as a whole, generally speaking, moves up over time, as evidenced by looking at a yearly chart of the DJIA. But, just like anything else, it will not go straight up or straight down. Looking at the stock market with a macro vision since its inception is interesting because, to a large extent, it is closely tied to the growth of the US economy, but the US stock market is not the best performing stock market every year. In fact, it may not be the best performing stock market in the world in any year for some decades.

Just like the US stock market is not the best performing market every year, many of the stocks within it will not be the best performers of a given year. The ones that are the best performers of a given year likely may not have been the best performers in preceding years and they may not be the best performers in the coming years. The most obvious question that this should bring up is how can we determine which is going to be the best performing industry in a given year and how can we determine which stocks within that industry will be the best performers as well. That, of course, is the million-dollar question because if anyone knew that answer with a good amount of certainty, they could be rich beyond their wildest dreams.

While we may not be able to predict with any certainty what individual stocks will be the best performers in any given year, we can look at what some of the recent worst performers have been. In doing so, we may be able to identify what industries are down now with the intent of using this information to give us some insight as to what industry sectors may begin to shine in the near future. Leading up to, and into 2008, when the news first broke about the real estate bubble popping and all of the foreclosures that were going to hit the market, banking and mortgage industry stocks really took a severe hit to their value. Though they fell out of favor for a time, most have recovered steadily over the past few years and many of them are as strong as ever. The same thing happened to other types of finance companies, though some of them have done reverse splits to prop up their share value, the value of the companies, and the prices of their stock have been steadily improving. Saying this isn’t 20/20 hindsight; there was very little likelihood that these industries would remain undervalued going forward a few years out into the future, if for no other reason than the US banking and finance industries are simply not industries that can go away or stay down forever.

One of the most obvious examples of a down industry that has turned itself around is the US auto industry, which many people around the country, not only left for dead, they seemed to have wanted it to die. The funny thing about this incredibly short-sighted stance is that if you look at all of the related industries that are tied to the US auto industry and if the US auto industry had gone away, a huge percentage of the US GNP would have gone with it, leaving our economy in ruins and maybe not much better, at that point, than some of the third world countries we see around the world. The domino effect would have been amazing and it wouldn’t have just been in the US. Since the US auto industry has been able to cut costs, shed their legacy costs, and improve market share (making them more competitive with the import car companies), their stock prices and profits have been rising along with the quality of their products, making it one of the very good performing industries of this past year. Again, saying this isn’t 20/20 hindsight, there was very little likelihood that this industry would remain undervalued going forward, if for no other reason than it is so far reaching its demise would have been catastrophic; it virtually had to recover.

When we see an industry that is taking it on the chin and getting shot down repeatedly, regardless of if the wounds are self inflicted or not, as investors and traders, we need to take a long and serious look at that specific industry to determine how likely is it that it will go away, how likely is it that it will recover, and what will be the recovery time if it does recover. This may be a longer time horizon than most traders are willing to look at, but it is something longer-term investors should definitely take a look at. Always remember the old stock market saying, “When there’s blood on the street, there’s money to be made.”

Today we’re going to discuss a trading style that most traders won’t admit to trading, but, in actuality, are most likely doing anyway. Most of our trading strategy discussions revolve around the idea of trend trading. This type of trading is where you would look to identify the trend or longer-term price action and then find your entry trigger to trade in the direction of this overall price movement. A counter-trend trade would occur during the opposite condition. In a counter-trend trade you would still identify the overall trend, but you would be looking to buy or sell opposite this trend. So if the trend was bullish and going up, you would look for opportunities to short and if the trend was bearish and going down, you would be looking to buy.

This might seem a bit counter intuitive to what you are used to, but it is a way to take advantage of price imbalance. As you evaluate the price action on a chart, you will be looking for a time when not only is the price trend moving up, but also having the current momentum moving up. So both the short and longer-term price action is in a bullish direction. Because of the way the price cycles, we know that after a strong move up, the price will go through a retracement or pullback of the original direction. This type of cyclic movement in the price action is what we are using to trade a counter-trend trade.

An example of this would occur when the price is trending up, which means the price over an extended time has been making higher highs and higher lows. This series of higher highs and higher lows is what makes a trend. During this time, as the price swings higher within the trend, we know that it will also go through a pullback. It is during this time of pullback that we will look to place a counter-trend trade.

Because of the nature of this type of trade, it is imperative that you use proper risk management and even consider taking a smaller position risk of the trade. If you normally trade with 2% risk, consider lowering that down to 1%. Also, because traders have the desire to be “right”, it is easy to get caught in a trade that doesn’t move counter to the trend. If this happens, we need to have a well-defined exit point that we are committed to follow. If not, we may end up on a trade that really catches the trend and goes on a significant run. In a situation like this we can experience a large drawdown and wish that we would have stuck with trading the trend.

Take some time to look at the idea of counter-trend trades to see if you can successfully trade these. Of course, make sure you are practicing them in a demo account so you can determine your abilities to follow your rules.

As we start our trading plans for the New Year, I would like to discuss the importance of first establishing and then following a consistent trading ROUTINE. When you think of what a trading routine is, you need to think in terms of what markets you trade, when you trade, what methods you use to trade, where you trade, and even why you trade. In order to trade successfully, is it important to first have a solid trading routine, but not just any trading routine is good enough. You need one that is best suited and adapted to your individual needs and circumstances. No matter what routine you establish, it should be one that you can continue to follow for the long run. In other words, it must be sustainable! For example, if you have a system that works well trading Forex at the London open, but you reside in the United States, you will need to arrange your schedule so that you are consistently available to trade very early in the morning as the London Forex markets open at 2 a.m. Eastern Standard Time (EST). If staying up that late is a challenge for you, then it may be more practical to adjust your trading system and routine to trade the Forex on the U.S. open, which is at 8 a.m. EST. In other words, the key to implementing a successful routine is to make it practical so we can follow through and be consistent with it.

One important key to deciding on a routine is what style of trading you like. For example, if you are planning on trading Forex on a daily basis, using daily charts, you will need far less time than if you want to “scalp” trade the market, which requires an exclusive block of time set every trading day. So, understanding what kind of trading style, and what markets you are interested in, in the long run, will help determine what routine you eventually decide is the best for you.

The next important consideration is how you trade or what system you use. I am not sure what comes first or what is more important – the system you use or the routine you follow? One thing is for certain, without a consistent routine, no matter of how good your system is, your chances for trading success is greatly diminished. In other words, you could have the best system available, but, without a consistent daily trading routine to follow, you will have trouble consistently implementing that system and getting the best results from that system.

The other important element of a consistent routine is the advantage it will give you to make sound logical trading decisions. Consistency is the key here to sustaining a good trading plan and good trading psychology. If you are not following a good routine, you will have a tendency to allow emotions to rule your trading and sabotage your trading success.

To me, the most important thing about a trading routine is to make sure that whatever you decide it is, pick the one that works with your personality and your schedule, so you can stick with it. Whatever you’re routine is, I also recommend that you WRITE IT DOWN so that it will be easier to stick with.

First of all, Happy New year to everyone! This is a great time of the year to be trading, whether you are new or experienced, the New Year gives us the opportunity to start fresh. Take some time to review this past year and decide on what things you will work on in 2014 to help you become a better trader.

Today we are going to talk about some of the two most important parts to the evaluation of a chart. These two things are ‘identifying trends’ and ‘recognizing momentum’. The idea of identifying trends and momentum should not be a new concept, but is one that should be readdressed on a regular basis. Knowing these two things will put us trading in the right direction.

The trend is the overall direction that the price has been moving over a longer time frame. This longer time frame will be different depending upon the charts we are looking at. On a daily chart it may be over the last few months, while on a 1-minute chart it may be over the last few hours. Regardless of the chart, the longer-term trend will give us the direction the price is likely to be moving in for the near future. The trend takes into consideration both the up swings, as well as the down swings, along the price movement higher or lower. This concept of trend is defined well in the statement that an uptrend is a series of higher highs and higher lows, while a downtrend is defined as a series of lower lows and lower highs.

The momentum of a chart can be looked at a bit differently. While still showing the direction the price is moving, it is doing so over a shorter time frame. The momentum of the price can be seen as the swings that are happening within the overall trend. The momentum can be moving down during an uptrend, as well as up during a downtrend. In fact, as we look for opportunities to enter into a trade, it is often times the case that the trend and the momentum have been moving in opposite directions.

As we look to utilize both the trend and the momentum on a chart, we will find that they both can help us better know when to enter the trade. For example, if we are looking to buy, we will want to see that the overall trend is moving up, but we may want to also see that the momentum has been moving down. In this situation where the price momentum has been going down or pulling back, we would then be looking for signs that the price is getting ready to move back in the direction of the overall trend. These areas of pullbacks can be great areas to look for our entry signals. The opposite would hold true if we were looking to sell.

Take some time to look at these two things to see if you can use them to help you better identify your entry points.

You’ve probably heard the phrase: “The trend is your friend.” I believe this is a true statement because trading with the trend is generally much easier to execute and a lot more forgiving. One of the most important things a trader can do is to determine the trend of the market, either up, down, or sideways.

To first determine the trend (either up or down) is the key to successful trend trading. The trend can be divided into three different time horizons: a long-term trend (weeks to months), medium-term trend (days to weeks), or short-term trend (hours to days). There is also very short-term trend (minutes to hours), but this is only looked at by very short-term traders or scalpers.

So what is a trend? Generally, the trend is defined as the price moving higher in a bull market and downward price movement in a bear market.

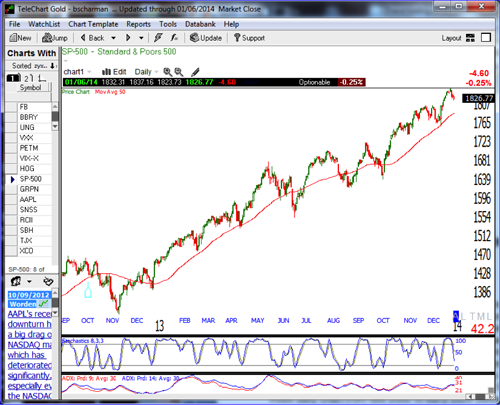
A bull market is defined as the price action moving higher by connecting higher highs and higher lows and is associated with increasing investor confidence and increased investing in anticipation of future price increases. A bullish trend in the stock market often begins before the general economy shows clear signs of recovery. For an example of a bull market, we can look at the current price action on the Standard and Poor’s market index below and can easily identify the current trend as “bullish”, as determined by the higher highs and higher lows as the price action has been moving higher. Note: As with any trend, the price does not just move higher, but moving up and then down and then back up again and this price movement is what we string together to identify a general direction of the market. Also note that in a strong uptrend over the last several months, the price is generally above the 50 period moving average and the 50 period moving average is also moving up at the same time. These conditions make for an easy way to identify or confirm a bullish trend.

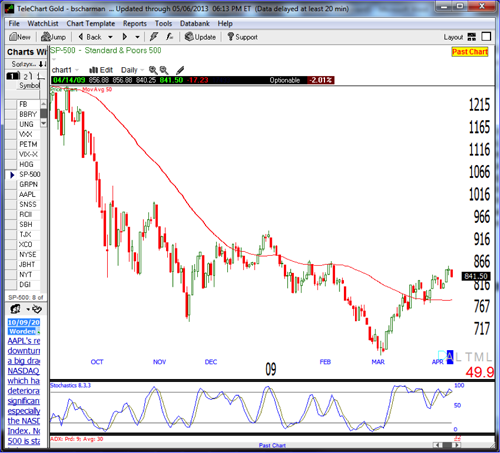
A bear market, or a bearish trend, is a general decline in the stock market prices with lower highs and lower lows over a period of time, depending on the length of the trend. A bearish market is generally associated with a transition from high investor optimism to widespread investor fear and pessimism. In addition to the price action moving lower, you can also notice if the price action is moving below the 50 period Simple Moving Average and the Moving Average is moving lower, then we have a confirmed bearish trend. Note: In the Chart of the Standard and Poor’s index daily chart below, see how to identify periods with a bearish trend.

In conclusion, trend trading is one of the best methods to trade. So being able to determine a confirmed up or down trend could greatly improve your success. Practice looking at different market charts and determining whether it is in a confirmed up or down trend, or neither.